参考:https://paper.seebug.org/841/#_1
部署afl
2
3
4
5
6
> tar -zxvf afl-latest.tgz
> cd afl-2.52b/
> make
> sudo make install
>
部署qemu
2
3
4
5
6
7
8
> [+] Build process successful!
> [*] Copying binary...
> -rwxr-xr-x 1 han han 10972920 7月 9 10:43 ../afl-qemu-trace
> [+] Successfully created '../afl-qemu-trace'.
> [!] Note: can't test instrumentation when CPU_TARGET set.
> [+] All set, you can now (hopefully) use the -Q mode in afl-fuzz!
>
0x01 白盒测试
目标程序编译
源代码
1
2
3
4
5
6
7
8
9
10
11
12
13
14#undef _FORTIFY_SOURCE
#include <stdio.h>
#include <stdlib.h>
#include <unistd.h>
void vulnerable_function() {
char buf[128];
read(STDIN_FILENO, buf, 256);
}
int main(int argc, char** argv) {
vulnerable_function();
write(STDOUT_FILENO, "Hello, World\n", 13);
}gcc编译(不插桩)
1
2
3
4$ gcc v1.c -o v1
$ ./v1
what
Hello, World
生成v1的目的一是为了和afl-gcc的编译做对比,二是为黑盒测试做铺垫。
- 使用afl-gcc进行编译
-fno-stack-protector 该选项会禁止stack canary保护
-z execstack 允许堆栈可执行1
2
3
4$ ../afl-2.52b/afl-gcc -fno-stack-protector -z execstack v1.c -o v1-afl
afl-cc 2.52b by <lcamtuf@google.com>
afl-as 2.52b by <lcamtuf@google.com>
[+] Instrumented 2 locations (64-bit, non-hardened mode, ratio 100%).
测试插桩程序
afl-showmap 跟踪单个输入的执行路径,并打印程序执行的输出、捕获的元组(tuples),tuple用于获取分支信息,从而衡量衡量程序覆盖情况。1
2
3
4
5
6
7
8
9
10$ ./afl-showmap -o /dev/null -- ../vuln/v1 <<(echo test)
afl-showmap 2.52b by <lcamtuf@google.com>
[*] Executing '../vuln/v1'...
-- Program output begins --
Hello, World
-- Program output ends --
[-] PROGRAM ABORT : No instrumentation detected
Location : main(), afl-showmap.c:773
1 | $ ./afl-showmap -o /dev/null -- ../vuln/v1-afl <<(echo test) |
可见,afl-gcc相对于gcc的不同在于采用了插桩计算覆盖率,在这个实例程序中捕捉到了一个元组
执行FUZZER
- 修改core
在执行afl-fuzz前,如果系统配置为将核心转储文件(core)通知发送到外部程序。1
2
3
4
5
6
7
8
9
10
11
12
13
14
15
16
17
18
19$ ./afl-fuzz -i ../vuln/testcase/ -o ../vuln/out/ ../vuln/v1-afl
afl-fuzz 2.52b by <lcamtuf@google.com>
[+] You have 2 CPU cores and 2 runnable tasks (utilization: 100%).
[*] Checking CPU core loadout...
[+] Found a free CPU core, binding to #0.
[*] Checking core_pattern...
[-] Hmm, your system is configured to send core dump notifications to an
external utility. This will cause issues: there will be an extended delay
between stumbling upon a crash and having this information relayed to the
fuzzer via the standard waitpid() API.
To avoid having crashes misinterpreted as timeouts, please log in as root
and temporarily modify /proc/sys/kernel/core_pattern, like so:
echo core >/proc/sys/kernel/core_pattern
[-] PROGRAM ABORT : Pipe at the beginning of 'core_pattern'
Location : check_crash_handling(), afl-fuzz.c:7275
将导致将崩溃信息发送到Fuzzer之间的延迟增大,进而可能将崩溃被误报为超时,所以我们得临时修改core_pattern文件,如下所示:1
echo core >/proc/sys/kernel/core_pattern
- 通用fuzz语法
afl-fuzz对于直接从stdin接受输入的目标二进制文件,通常的语法是:1
$ ./afl-fuzz -i testcase_dir -o findings_dir / path / to / program [... params ...]
对于从文件中获取输入的程序,使用“@@”标记目标命令行中应放置输入文件名的位置。模糊器将替换为您:1
$ ./afl-fuzz -i testcase_dir -o findings_dir / path / to / program @@
此时afl会给我们返回一些信息,这里提示我们有些测试用例无效1
2
3
4
5
6
7
8
9
10
11
12
13
14
15
16
17
18
19
20
21
22
23
24
25
26
27
28
29
30
31afl-fuzz 2.52b by <lcamtuf@google.com>
[+] You have 2 CPU cores and 2 runnable tasks (utilization: 100%).
[*] Checking CPU core loadout...
[+] Found a free CPU core, binding to #0.
[*] Checking core_pattern...
[*] Setting up output directories...
[+] Output directory exists but deemed OK to reuse.
[*] Deleting old session data...
[+] Output dir cleanup successful.
[*] Scanning '../vuln/testcase/'...
[+] No auto-generated dictionary tokens to reuse.
[*] Creating hard links for all input files...
[*] Validating target binary...
[*] Attempting dry run with 'id:000000,orig:1'...
[*] Spinning up the fork server...
[+] All right - fork server is up.
len = 3, map size = 1, exec speed = 295 us
[*] Attempting dry run with 'id:000001,orig:2'...
len = 23, map size = 1, exec speed = 125 us
[!] WARNING: No new instrumentation output, test case may be useless.
[+] All test cases processed.
[!] WARNING: Some test cases look useless. Consider using a smaller set.
[+] Here are some useful stats:
Test case count : 1 favored, 0 variable, 2 total
Bitmap range : 1 to 1 bits (average: 1.00 bits)
Exec timing : 125 to 295 us (average: 210 us)
[*] No -t option specified, so I'll use exec timeout of 20 ms.
[+] All set and ready to roll!
- 状态窗口
我们可以看到afl很快就给我们制造了崩溃
1 | american fuzzy lop 2.52b (v1-afl) |
由上面AFL状态窗口:
① Process timing:Fuzzer运行时长、以及距离最近发现的路径、崩溃和挂起(超时)经过了多长时间。
已经运行4m19s,距离上一个最新路径已经过去2min27s,距离上一个独特崩溃已经过去4min19s(可见找到崩溃的速度非常快),距离上一次挂起已经过去2m12s。
② Overall results:Fuzzer当前状态的概述。
③ Cycle progress:我们输入队列的距离。队列一共有3个用例,现在是第二个,66.67%
④ Map coverage:目标二进制文件中的插桩代码所观察到覆盖范围的细节。
⑤ Stage progress:Fuzzer现在正在执行的文件变异策略、执行次数和执行速度。
⑥ Findings in depth:有关我们找到的执行路径,异常和挂起数量的信息。
⑦ Fuzzing strategy yields:关于突变策略产生的最新行为和结果的详细信息。
⑧ Path geometry:有关Fuzzer找到的执行路径的信息。
⑨ CPU load:CPU利用率
afl何时结束
(1) 状态窗口中”cycles done”字段颜色变为绿色该字段的颜色可以作为何时停止测试的参考,随着周期数不断增大,其颜色也会由洋红色,逐步变为黄色、蓝色、绿色。当其变为绿色时,继续Fuzzing下去也很难有新的发现了,这时便可以通过Ctrl-C停止afl-fuzz。
(2) 距上一次发现新路径(或者崩溃)已经过去很长时间
(3) 目标程序的代码几乎被测试用例完全覆盖
处理输出结果
确定造成这些crashes的bug是否可以利用,怎么利用?
afl在fuzzing的过程中同时也产生了这些文件1
2
3
4
5
6
7
8
9
10
11
12
13
14$ tree ../vuln/out/
../vuln/out/
├── crashes
│ ├── id:000000,sig:11,src:000000,op:havoc,rep:64
│ └── README.txt
├── fuzz_bitmap
├── fuzzer_stats
├── hangs
├── plot_data
└── queue
├── id:000000,orig:1
└── id:000001,orig:2
3 directories, 7 files
在输出目录中创建了三个子目录并实时更新:
- queue: 测试每个独特执行路径的案例,以及用户提供的所有起始文件。
- crashes: 导致被测程序接收致命信号的独特测试用例(例如,SIGSEGV,SIGILL,SIGABRT)。条目按接收信号分组。
- hangs: 导致测试程序超时的独特测试用例。将某些内容归类为挂起之前的默认时间限制是1秒内的较大值和-t参数的值。可以通过设置AFL_HANG_TMOUT来微调该值,但这很少是必需的。
- 崩溃和挂起被视为“唯一” :如果相关的执行路径涉及在先前记录的故障中未见的任何状态转换。如果可以通过多种方式达到单个错误,那么在此过程中会有一些计数通货膨胀,但这应该会迅速逐渐减少。
- fuzzer_stats:afl-fuzz的运行状态。
- plot_data:用于afl-plot绘图。
崩溃类型和可利用性
triage_crashes
AFL源码的experimental目录中有一个名为triage_crashes.sh的脚本,可以帮助我们触发收集到的crashes。例如下面的例子中,11代表了SIGSEGV信号,有可能是因为缓冲区溢出导致进程引用了无效的内存;06代表了SIGABRT信号,可能是执行了abort\assert函数或double free导致,这些结果可以作为简单的参考。1
2$ experimental/crash_triage/triage_crashes.sh ../vuln/out/ ../vuln/v1-afl 2>&1 | grep SIGNAL
+++ ID 000000, SIGNAL 11 +++crashwalk
如果你想得到更细致的crashes分类结果,以及导致crashes的具体原因,那么crashwalk就是不错的选择之一。这个工具基于gdb的exploitable插件,安装也相对简单,在ubuntu上,只需要如下几步即可:1
2
3
4
5
6
7
8$ apt-get install gdb golang
$ mkdir tools
$ cd tools
$ git clone https://github.com/jfoote/exploitable.git
$ mkdir go
$ export GOPATH=~/tools/go
$ export CW_EXPLOITABLE=~/tools/exploitable/exploitable/exploitable.py
$ go get -u github.com/bnagy/crashwalk/cmd/...
- 这部分我好像还没完成
- afl-collect
1
2
3
4
5$ afl-collect -d crashes.db -e gdb_script -j 8 -r ../vuln/out/ ../vuln/testcase -- ../vuln/v1-afl
*** GDB+EXPLOITABLE SCRIPT OUTPUT ***
[00001] out:id:000000,sig:11,src:000000,op:havoc,rep:64.................: EXPLOITABLE [ReturnAv (1/22)]
*** ***************************** ***
0x02 代码覆盖率及其相关概念
代码覆盖率是模糊测试中一个极其重要的概念,使用代码覆盖率可以评估和改进测试过程,执行到的代码越多,找到bug的可能性就越大,毕竟,在覆盖的代码中并不能100%发现bug,在未覆盖的代码中却是100%找不到任何bug的。
代码覆盖率是一种度量代码的覆盖程度的方式,也就是指源代码中的某行代码是否已执行;对二进制程序,还可将此概念理解为汇编代码中的某条指令是否已执行。其计量方式很多,但无论是GCC的GCOV还是LLVM的SanitizerCoverage,都提供函数(function)、基本块(basic-block)、边界(edge)三种级别的覆盖率检测。
计算代码覆盖率
GCOV:插桩生成覆盖率 LCOV:图形展示覆盖率 afl-cov:调用前两个工具计算afl测试用例的覆盖率
gcc插桩
-fprofile-arcs -ftest-coverage1
$ gcc -fprofile-arcs -ftest-coverage ./v1.c -o v1-cov
afl-cov计算之前fuzzer的过程(结束后)
1
2
3
4
5
6
7
8
9
10
11
12
13
14
15
16
17
18
19
20
21
22
23
24
25
26
27
28
29
30
31
32
33
34
35
36
37
38
39$ ../afl-2.52b/afl-cov/afl-cov -d ./out/ --enable-branch-coverage -c . -e "cat AFL_FILE | ./v1-cov AFL_FILE"
Non-zero exit status '1' for CMD: /usr/bin/readelf -a cat
*** Imported 2 new test cases from: ./out//queue
[+] AFL test case: id:000000,orig:1 (0 / 2), cycle: 0
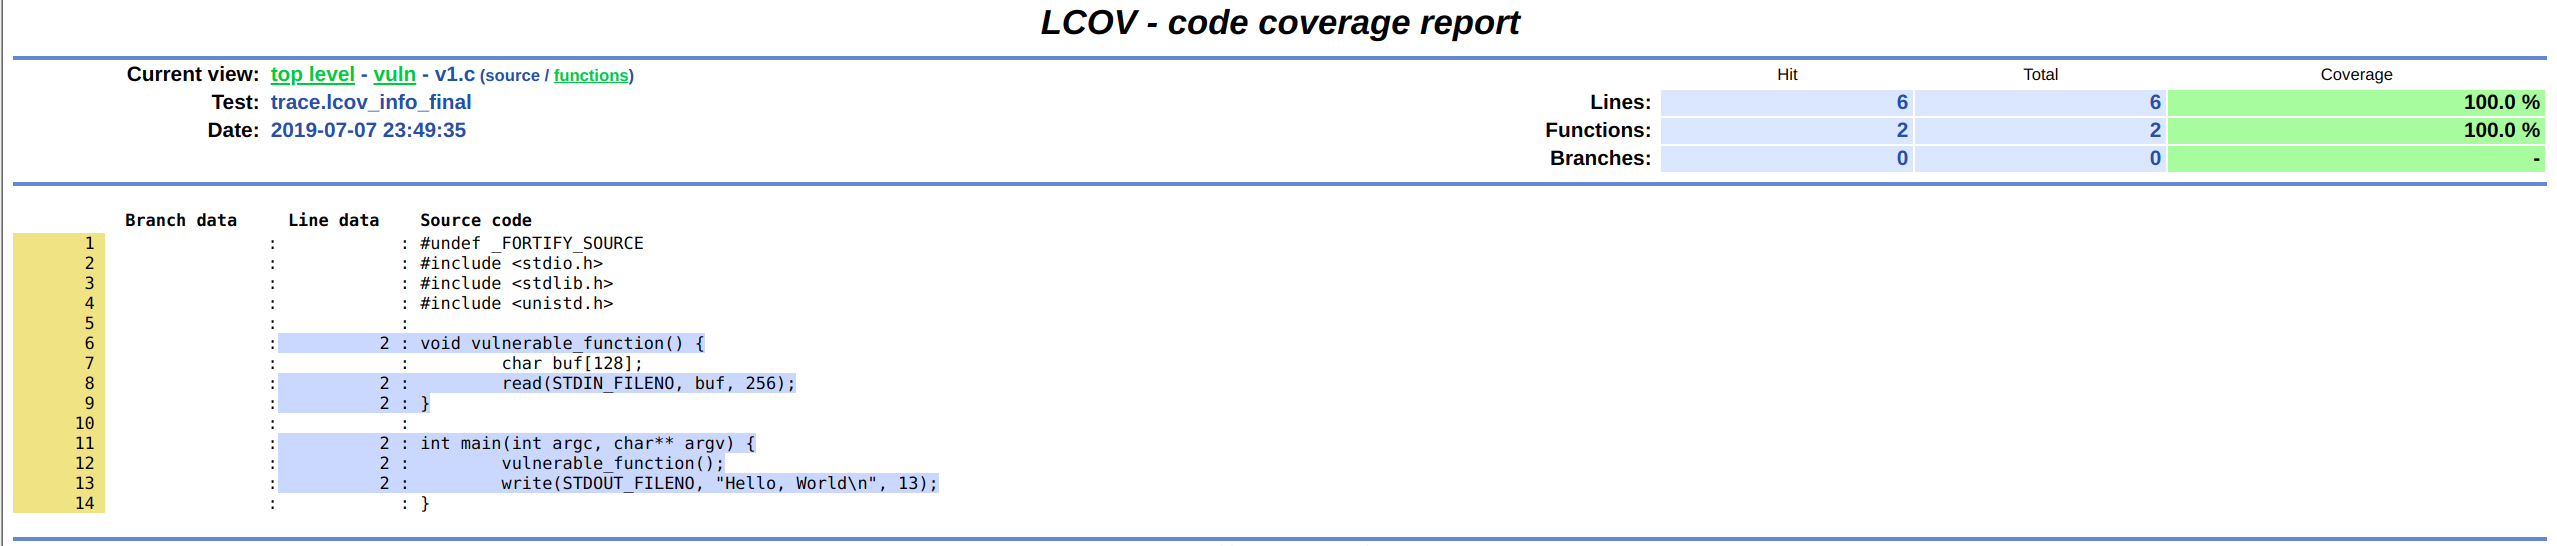
lines......: 100.0% (6 of 6 lines)
functions..: 100.0% (2 of 2 functions)
branches...: no data found
Coverage diff (init) id:000000,orig:1
diff (init) -> id:000000,orig:1
New src file: /home/han/ck/vuln/v1.c
New 'function' coverage: main()
New 'function' coverage: vulnerable_function()
New 'line' coverage: 11
New 'line' coverage: 12
New 'line' coverage: 13
New 'line' coverage: 6
New 'line' coverage: 8
New 'line' coverage: 9
++++++ BEGIN - first exec output for CMD: cat ./out//queue/id:000000,orig:1 | ./v1-cov ./out//queue/id:000000,orig:1
Hello, World
++++++ END
[+] AFL test case: id:000001,orig:2 (1 / 2), cycle: 0
lines......: 100.0% (6 of 6 lines)
functions..: 100.0% (2 of 2 functions)
branches...: no data found
[+] Processed 2 / 2 test cases.
[+] Final zero coverage report: ./out//cov/zero-cov
[+] Final positive coverage report: ./out//cov/pos-cov
lines......: 100.0% (6 of 6 lines)
functions..: 100.0% (2 of 2 functions)
branches...: no data found
[+] Final lcov web report: ./out//cov/web/index.htmlLCOV展示
0x03 黑盒测试(使用qemu
1 | $ ./afl-fuzz -i ../vuln/testcase/ -o ../vuln/outQemu -Q ../vuln/v1 |
- 待完成对黑盒测试原理的分析